Woodland Project Phase 2 Survey Report
Mosses
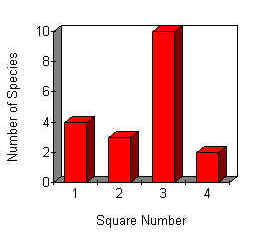
Twelve bryophyte species were found on the project site. This included 11 species of moss and one liverwort, Lepidozia reptans. This represents an increase of two species over the initial survey. In the initial survey, mosses formed part of the ground flora in only two of the representative regions of the project site. These were Area 3 and Area 1. Area 3 had the highest level of diversity (10 species) because it had already had two years in which to regenerate after clearance of the Rhododendron cover. Area 1 had two species of moss colonising flints on the surface of the soil, plus an almost imperceptible amount of a third species on the soil surface. The flints, peculiar to this area, were thought to be important in that they raised the mosses above the level of the leaf litter. This would automatically increase the level of light available to them. Mosses now form part of the ground flora in all regions of the project site, albeit mostly in very small quantities (Table 2). The distribution of individual moss species was very patchy and the quantities present generally very small. It is therefore difficult to draw any meaningful quantitative comparisons between the results obtained in this survey and those obtained in the initial survey. This has therefore not been attempted. |
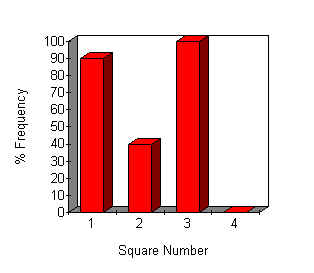
Percentage frequency is a measure of the number of times an organism or group of organisms is found in samples. For example, if a species occurs in all samples, it would have a % frequency of 100%. If it only occurred in 1 out of 10 samples, it would have a % frequency of 10. It is therefore basically a measure of degree of distribution, which is obviously also related to abundance. Regional differences in moss % frequency are illustrated in Figure 13. | |
Figure 13. The % Frequency of mosses . |
Mosses were most widely distributed in Squares 1 and 3 (Figure 13). This is to be expected, given that they were a component of the ground flora in both regions in the initial survey. No mosses were found in any of the quadrats in Square 4, although minute quantities of Hypnum cupressiforme and Hypnum andoi occurred on bark litter on the soil surface. These two species, plus one other, Hypnum resupinatum, were the most widespread species on the project site, also occurring in Areas 1, 2 and 3 (Table 2). Hypnum cupressiforme and H. andoi were both present on the site prior to clearance, clothing Rhododendron trunks where light levels allowed. (This was usually adjacent to large deciduous trees, which would permit higher light levels in the winter with the shedding of the leaf canopy.) |
Area 3 contained the most
diverse moss flora, with 10 of the 11 species recorded occurring in the quadrats sampled
(Figure 14). (The eleventh species was also present, although not in the samples.) The
most abundant species in this region were Hypnum cupressiforme and H. andoi,
plus Dicranella heteromalla (Table 2). A single new species (Leucobryum glaucum),
not previously recorded on the site, was found in this region. The number of moss species was very limited in the remaining regions (Figure 14), but presumably they will become more diverse and similar to Area 3 as time passes. |
|
Figure 14. Regional Variations in Moss Diversity |
HABITATS Most of the mosses found on the
project site are characteristic of woodland habitats. Many of them are also chiefly or
exclusively found on acid substrata. These species include Dicranella heteromalla, Campylopus
paradoxus, Leucobryum glaucum, Polytrichum formosum and the liverwort, Lepidozia
reptans (Watson). Hypnum cupressiforme, Hypnum
andoi and Isothecium myosuroides are characteristically found on trees, stumps
and logs in woodland. Hypnum resupinatum is generally common (Watson), but its habitats include bark and logs in light
shade (Smith). Campylopus pyriformis occurs on
peaty soils, even in quite deep shade and can be found on raw humus in woods (Watson). Campylopus introflexus is also
characteristic of peaty soils. |
Table 2. Regional Variations in % Frequency and mean % Cover of |
||||||||||||||||||||||||||||||||||||||||||||||||||||||||||||||||||||||||||||||||||||||||||||||||||||||||||||
|
||||||||||||||||||||||||||||||||||||||||||||||||||||||||||||||||||||||||||||||||||||||||||||||||||||||||||||
% F = % Frequency of the species. % C = Mean % Cover within the Sampled Quadrats |
Woodland Project Phase 2 |
||
Results |
||