Offwell Wetland Survey
Bar Charts illustrating zonation patterns.
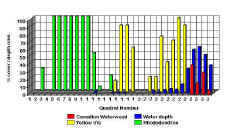
The bar charts which can be accessed below illustrate the % cover of three plant species
in relation to water depth. The three species chosen from each transect show the extremes
of zonation in the wetland area. Transect 1 (N/S) is illustrated by Rhododendron, Yellow
Iris and Canadian Pondweed. Transect 2 (E/W) uses Silver Birch, Yellow Iris and Bog Bean.