|
The Woodland Education Centre |
|
|
The Woodland Education Centre |
|
Comparison of Sampling Methods
| Results obtained using different methods of sampling may often be very
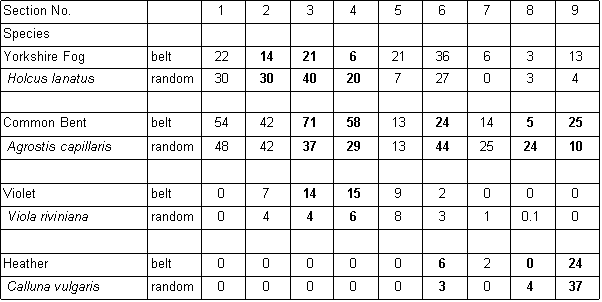
different. This is well illustrated by a comparison of results obtained for a few selected
species in 1997, using both the belt transect and the random quadrat sampling methods. This highlights the need to use the same sampling method when comparing data collected at different times. |

| Comparison of data (mean % cover) obtained in 1997, using two different sampling methods |
| There are two reasons for the different results
obtained using the belt transect and random quadrat methods. The first is related to the
number of samples taken. The random quadrat data is based on twice the number of samples
in each section compared to the belt transect. The greater the number of samples taken,
the more reliable are the data obtained. The optimum minimum number of samples which should be taken can be established by constructing a species area curve for the site. This is done by taking a large number of samples and then drawing a graph of the total number of species found against the number of samples taken. This is called the species area curve. This method is really only relevant where the vegetation is homogeneous. The heathland site is obviously not homogeneous overall, with different sections having quite different vegetation in some cases. Species area curves were therefore constructed for each section (Figure below). A species area curve for the whole site was then constructed by taking mean values of all the sections (Figure J below) At the point indicated by P (Figure J below) the curve is levelling out to a straight line. This indicates that even if more samples were taken, the number of species found would not increase substantially. This point (14 samples) represents the minimum number of samples which will be representative for the site. |
|
|
|
A |
B |
C |
|
|
|
D |
E |
F |
|
|
|
G |
H |
I |
These graphs demonstrate the effect of the number of quadrats sampled on the number of species recorded. |
|
At the point indicated by P (Figure J, left) the curve is levelling out to a straight line. This indicates that even if more samples were taken, the number of species found would not increase substantially. |
- |
J |
- |
The effect of the number of quadrats sampled on the number of species recorded. |
| Belt transect data for the site is based on between 6
-16 samples depending on the width of the section sampled at the point of the transect
line. The mean number of samples per section was 7. This number was adequate for certain
of the sections (3,4,5 and 9 -Figures ;C,D,E,I above) but not for the other sections.
Random sampling was introduced in 1997 to give better overall cover of the sections and to
incorporate a greater number of samples for each section. The mean number of random
samples for each section was 14, which is a sufficient level of accuracy as determined by
the overall species area curve (Figure J above). The random sampling data is a better reflection of the vegetation on the site because the samples potentially cover the whole area of each section and not just a narrow band across the middle, as in the belt transect. The distribution of many of the species on the site is patchy, and the greater the area sampled, the more accurate the data will be. The belt transect data, while inadequate on its own, in combination with the random samples gives a good picture of the vegetation on the site and its changes over time. For the reasons outlined above, where changes are being compared for the years 1996 - 1998, only belt transect data is used, to allow strict comparisons to be made. Where the years 1997 and 1998 only, are being compared, an average of belt transect data and random quadrat data has been calculated to give a mean value which encompasses both methods. |
Continue to >> Plant Species List
Ecological Surveys 96 - 98 |