An Ecological Sampling Exercise
Processing & Interpreting Raw Data
Contents

Exercise using the Raw Data

wpeBC.jpg (47687 bytes)

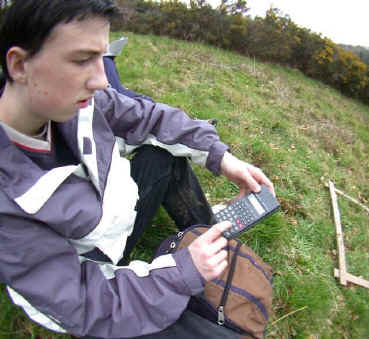
The raw data forming the basis of this theoretical exercise was collected by students in a practical ecological sampling exercise on the Heathland Restoration Project area, at the Woodland Education Centre, Offwell.  The exercise presented below was the follow-up exercise which the students carried out to analyse their data.

In order to answer some of the questions, students will need to visit the Heathland Restoration Project to access additional background information on the site.


Thanks are due to Dr Wendy Graham and the Axe Valley Community College, for permission to publish the raw data and follow-up exercise.


Sections in blue are not part of the original exercise set by Dr Graham for her students. They have been added to the exercise to further test skills in extracting information from the data and interpreting it, as well as in using statistical methods. They are optional.

wpeD1.jpg (5850 bytes)Using the Data

  1. Enter the raw data onto a spreadsheet.       (Example of a data spreadsheet from another project)

  2. Work out the mean values for percentage cover of Bluebells for each whole section, as well as separately for the top and bottom of each of sections 2 - 4.

  3. Is there a clear difference between the % Bluebell cover in the top and bottom sections of strip numbers 2 - 4?

  4. If there is a difference, how might this difference be explained?
    (
    Visit the Heathland Restoration Project for background information to help you explain.)

    Is the degree of difference between the top and bottom of the strips the same in
    each case for strips 2 - 4? If not, can you think of any explanations for this?

    .

  5. Is there any difference in the % Bluebell cover between the spring and autumn brushcut strips?

  6. How might any such difference be explained?

  7. There are no Bluebells in strip 5 (the control strip) now. What is going to happen to strip 5 if it is left totally unmanaged?  (Visit lowland heath if you need help with explaining this.)

  8. The timing each year of the spring brushcut is not exact. What effect might this have on the following year's Bluebells?

  9. Are the strips / sections exact replicas of each other? Does this matter?

  10. This was a 'stratified' random sampling' exercise. Would a belt transect (systematic sampling) have given 'better' results?


  • For sampling to be truly random, each point in the sampling area must have an equal chance of being sampled. Did the method used meet this condition?

  • Are there any factors other than management which might influence the Bluebell distribution in the strips?

  • What prior data might help you to interpret the results better?

  • Which value, the median or the mean, do you think gives the best description of the mid point of the data sets? Give your reasons.

  • What statistical test might you use to determine whether any differences between the strips, as well as between the top and bottom of the strips, were statistically significant? Explain your choice.

  • If you were to redo this sampling exercise, how might you improve it?

  • If the climate in the South-west of Britain becomes dryer and warmer as a result of Global Warming, what will happen to the Bluebells in this area?


Note for Teachers


Contents