|
|
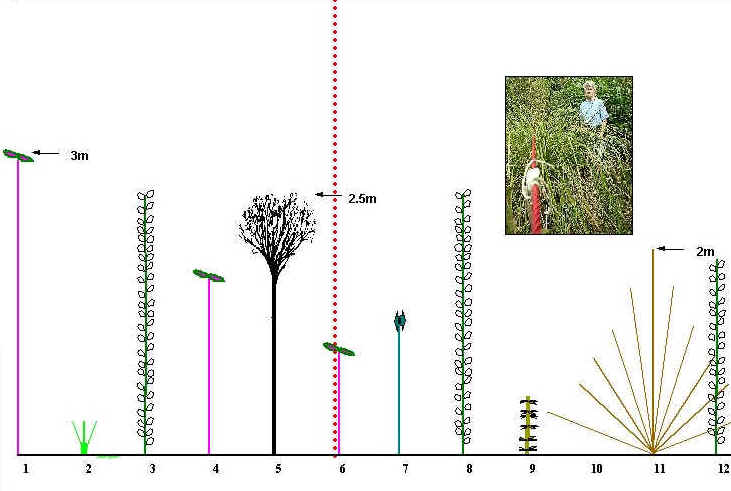
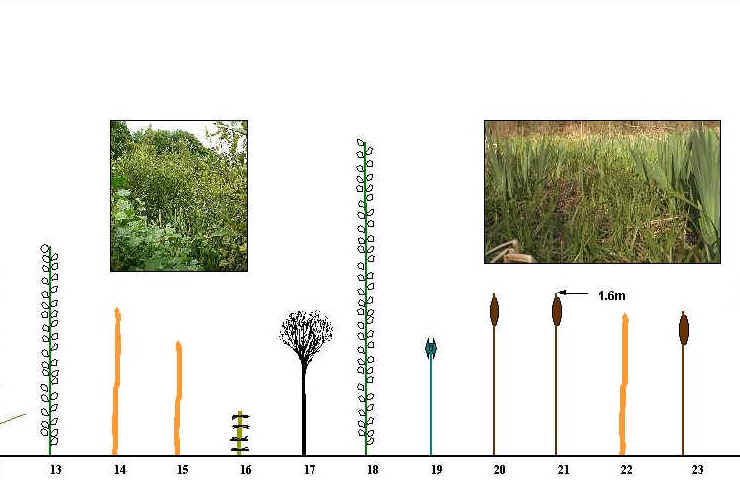
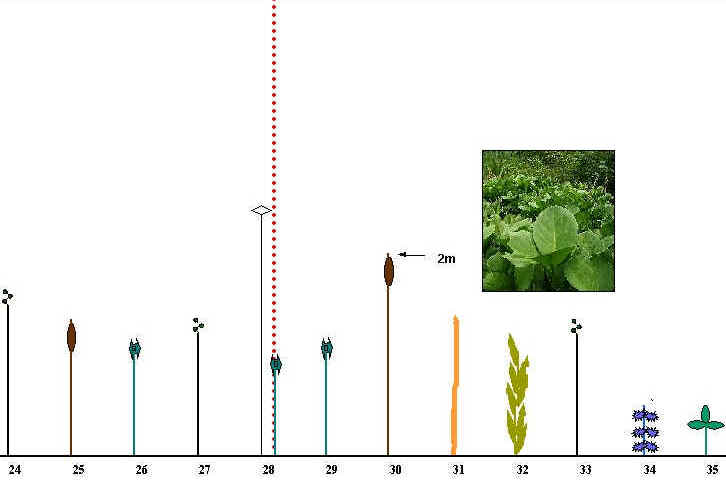
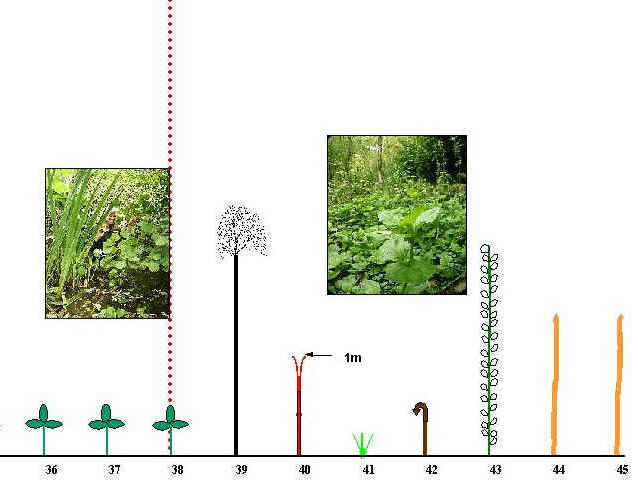
| The diagram below illustrates all the plants which touched the transect line. Click here for an overview of the transect position in the Wetland. This transect is marked by the yellow line on the photograph. The plants are diagrammatically represented In the illustration below. The horizontal scale is in metres. Click here for the Key to Species. The water levels are illustrated at the bottom of the diagram. Blue indicates standing water, marked with the approximate depth. Areas without standing water are indicated by the colour olive. Where the areas are adjacent a gradient exists, except on the stream bank which is at 37.5 metres. Marked water levels are not absolute, but will fluctuate according to the amount of water entering the wetland. Photographs have been used to give a general idea of the vegetation at particular points. The photographs were not necessarily taken at exactly the same time as the survey. Therefore certain species, although present, may not be conspicuous. Maximise your screen now to view this diagram. Windows users can press the F11 key to alternate the screen between full screen and normal. |
|
||||||||
 |
 |
 |
 |
|||||
| EAST | . |
. |
10cms depth |
2cms |
6cms |
1cm |
. |
4cms |
2cms |
. |
. |
. | . | 4cms |
7cms |
15cms |
22cms |
60cms |
. | WEST. |
| The diagram
above clearly shows the plant zonation patterns across the wetland. There is a very narrow dry land zone on the eastern section of this transect (1-6m mark). The plant species here are those which prefer drier conditions. They include species such as Silver Birch and Rhododendron. Willow also grows here, although it is mainly found in the marsh region. The Rhododendron, which originally covered the entire area, still occurs in a narrow band down both the East and West sides of the wetland and in the Northern dry land area. It is prevented from encroaching further by the wet, marsh conditions in the adjacent areas. The dry land areas grade very quickly into marsh (6-28m). The marsh zone is characterised by water-logged sediments and levels of standing water which vary with the topography of the zone. Dips and hollows fill with water, while higher mounds are dry. It must be stressed that the water levels marked on the diagram above were correct at the time of the survey. However, they will fluctuate according to the amount of rainfall and stream water which is entering the wetland. The marsh zone is characterised by species such as Willow, Wood Clubrush, Greater Tussock Sedge, Reedmace, Yellow Iris, Marsh Bedstraw and Branched Bur-reed. Water Mint is also very prevalent in this area, but as an anomaly, due to the one metre recording interval, it has not been picked up at all. The Silver Birch at the 16m mark was on a mound raised above the general level of the marsh. It was therefore dry enough at this point for the Silver Birch to survive. As the water level begins to rise (29m mark), the marsh plants begin to die out. Water Mint and Branched Bur-reed are the last to die out. As the marsh plants disappear and water depth increases, swamp plants such as Bog Bean take over (35-38m). The swamp ends adjacent to the incoming stream channel. The western bank of the stream very abruptly marks the end of the deep water zone (38m). The west bank of the stream is raised and Alder trees have grown up here. Marsh species predominate to the west of this region. The species here are slightly different to the marsh species in the centre of the wetland. Soft Rush and Pendulous Sedge are common in this area. The E/W continuous line transect is valuable in that it picks up most of the species present in the transect area (36 species in this case). However, the great number of plants which have to be diagrammatically represented along the line makes the illustration quite difficult to look at and extract information from. There is a great deal of 'clutter' taking the eye away from general patterns of distribution. Patterns of zonation are somewhat clearer in the interrupted line transect pictured above, where records were taken every metre. This is because a lot of the less dominant species have been removed from the picture. However, this transect diagram does not show the patterns of zonation as clearly as the corresponding transect diagram for the N/S transect. This is because the 1m transect interval in this E/W transect picks up only about half of the species present (19, as opposed to 36 for the continuous line transect). In other words, rather too much 'clutter' has been removed. There is an added disadvantage with this line transect in that it is likely to underestimate the range of each species. This is the total region through which the species can be found. As records are only being taken at every metre mark, plants will only be recorded if they happen to touch the line at the right point. This is illustrated by the apparent absence of Water Mint in the marsh zone, when in fact it is very common there (see the continuous line transect diagram). The range of a number of the more important plant species distributed along the East/West line transect is shown here. This diagram was derived from the continuous line transect data, for the reason noted just previously. Why use line transects? - the merits of different types of line transect.
|
||