|
The Woodland Education Centre |
|
|
The Woodland Education Centre |
|
Ecological Survey 2000
These descriptions
build upon the descriptions of the sections given in the 1999 ecological survey and should
be read in conjunction for maximum benefit. |
Section 5 (Control)
Observations 1999 - 2000
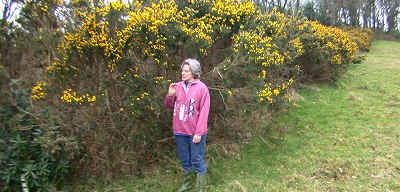 |
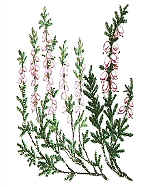
Section 5 was a dense tangled
mass of gorse, much of it now 2.5 to 3 metres tall, intertwined with brambles and some
Raspberry. Raspberry had become a dominant species in this section. |
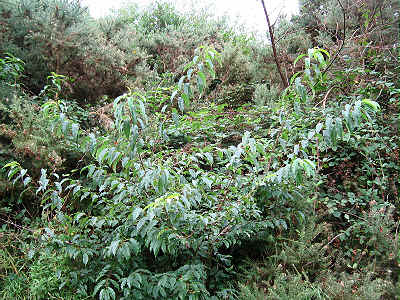 |
Tree saplings were well
established amongst the gorse, with the main species being birch, cherry (left) , Hazel and willow. In places, the birch and willow were beginning to overtop the gorse. |
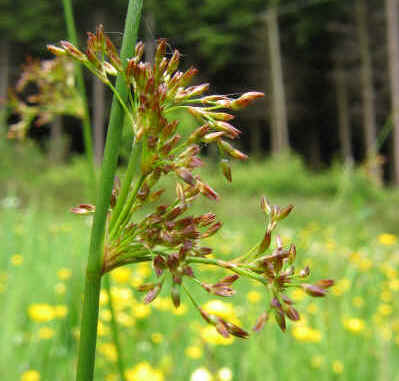 |
Soft Rush (left) became a dominant
species in this section, while Compact
Rush had decreased. Grasses had also decreased in abundance. Yorkshire Fog was no longer a dominant species and Common Bent had more than halved in extent. |
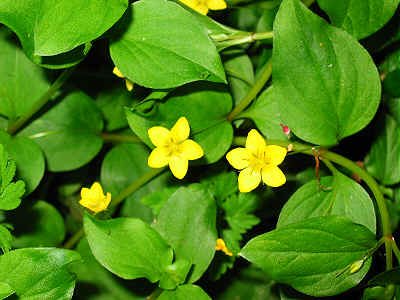 |
Yellow
Pimpernel (left) had become a
dominant species in the ground layer. Violets increased in abundance, while Bugle
declined. Eurhynchium praelongum also substantially increased as part of the ground flora and on the lower part of the trunks of gorse and tree saplings. |
Dominant Plants in
Section 5 in 2000
with figures from 1999 for comparison.
Characteristic heath species are in bold print
| Species | Overall % frequency | Mean % Cover (all quadrats) | ||
| 2000 | 1999 | 2000 | 1999 | |
| Bramble | 94 | 92 | 57 | 47 |
| Eurhynchium praelongum | 88 | 42 | 42 | 13 |
| Common Dog-violet | 69 | 67 | 16 | 10 |
| Silver Birch | 60 | 79 | 27 | 32 |
| European Gorse | 63 | 67 | 60 | 44 |
| Thuidium tamarascinum | 41 | 29 | 26 | 10 |
| Bugle | 35 | 46 | 4 | 8 |
| Soft Rush | 32 | 4 | 11 | 15 |
| Common Bent | 28 | 67 | 6 | 16 |
| Raspberry | 26 | 0 | 11 | 0 |
| Yellow Pimpernel | 26 | 21 | 2 | 3 |
| Percentage frequency = the percentage of the total number of quadrats sampled over the whole site which contain the species. For example, a percentage frequency of 100%, means that the species was found in all quadrats sampled. |
>> Continue to Grass Charts
Ecological Survey 2000 |