ECOLOGICAL SAMPLING METHODS
Contents

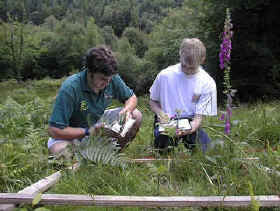
| WHY DO WE NEED TO SAMPLE? If we want to know what kind of plants and animals are in a particular habitat, and how many there are of each species, it is usually impossible to go and count each and every one present. It would be like trying to count different sizes and colours of grains of sand on the beach. This problem is usually solved by taking a number of samples from around the habitat, making the necessary assumption that these samples are representative of the habitat in general. In order to be reasonably sure that the results from the samples do represent the habitat as closely as possible, careful planning beforehand is essential. Samples are usually taken using a standard sampling unit of some kind. This ensures that all of the samples represent the same area or volume (water) of the habitat each time. The usual sampling unit is a quadrat. Quadrats normally consist of a square frame, the most frequently used size being 1m 2 (see picture below). The purpose of using a quadrat is to enable comparable samples to be obtained from areas of consistent size and shape. Rectangular quadrats and even circular quadrats have been used in some surveys. It does not really matter what shape of quadrat is used, provided it is a standard sampling unit and its shape and measurements are stated in any write-up. It may however be better to stick to the traditional square frame unless there are very good reasons not to, because this yields data that is more readily comparable to other published research. (For instance, you cannot compare data obtained using a circular quadrat, with data obtained using a square quadrat. The difference in shape of the sampling units will introduce variations in the results obtained.)
|
| right: A quadrat is used to sample the species present in a habitat. |  |
| Choice of quadrat size depends to a large extent on the type of survey being conducted. For instance, it would be difficult to gain any meaningful results using a 0.5m2 quadrat in a study of a woodland canopy! Small quadrats are much quicker to survey, but are likely to yield somewhat less reliable data than large ones. However, larger quadrats require more time and effort to examine properly. A balance is therefore necessary between what is ideal and what is practical. As a general guideline, 0.5 - 1.0m2 quadrats would be suggested for short grassland or dwarf heath, taller grasslands and shrubby habitats might require 2m quadrats, while quadrats of 20m2 or larger, would be needed for woodland habitats. At the other end of the scale, if you are sampling moss on a bank covered with a very diverse range of moss species, you might choose to use a 0.25m2 quadrat.
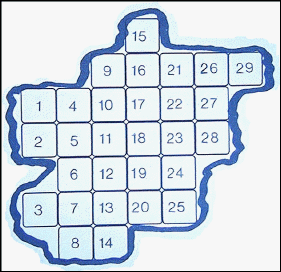
Quadrats are most often used for sampling, but are not the only type of sampling units. It depends what you are sampling. If you are sampling aquatic microorganisms or studying water chemistry, then you will most likely collect water samples in standard sized bottles or containers. If you are looking at parasites on fish, then an individual fish will most likely be your sampling unit. Similarly, studies of leaf miners would probably involve collecting individual leaves as sampling units. In these last two cases, the sampling units will not be of standard size. This problem can be overcome by using a weighted mean, which takes into account different sizes of sampling unit, to arrive at the mean number of organisms per sampling unit. There are three main ways of taking samples. 1. Random Sampling. 2. Systematic Sampling (includes line transect and belt transect methods). Random sampling is usually carried out when the area under study is fairly uniform, very large, and or there is limited time available. When using random sampling techniques, large numbers of samples/records are taken from different positions within the habitat. A quadrat frame is most often used for this type of sampling. The frame is placed on the ground (or on whatever is being investigated) and the animals, and/ or plants inside it counted, measured, or collected, depending on what the survey is for. This is done many times at different points within the habitat to give a large number of different samples. In the simplest form of random sampling, the quadrat is thrown to fall at ‘random’ within the site. However, this is usually unsatisfactory because a personal element inevitably enters into the throwing and it is not truly random. True randomness is an important element in ecology, because statistics are widely used to process the results of sampling. Many of the common statistical techniques used are only valid on data that is truly randomly collected. This technique is also only possible if quadrats of small size are being used. It would be impossible to throw anything larger than a 1m2 quadrat and even this might pose problems. Within habitats such as woodlands or scrub areas, it is also often not possible to physically lay quadrat frames down, because tree trunks and shrubs get in the way. In this case, an area the same size as the quadrat has to be measured out instead and the corners marked to indicate the quadrat area to be sampled. A better method of random sampling is to map the area and then to lay a numbered grid over the map. A (computer generated) random number table is then used to select which squares to sample in. (Random number Table). For example, if we have mapped our habitat , and have then laid a numbered grid over it as shown (Figure - below) , we could then choose which squares we should sample in by using the random number table.
|
||||||||||||||||||||||||||||||||||||||||||||||||||||||||||||||||||||||||||||||||||||||||||||||||||||||||
|
||||||||||||||||||||||||||||||||||||||||||||||||||||||||||||||||||||||||||||||||||||||||||||||||||||||||
If we look at the top of the first column in the random number table, our first number is 20. Moving downwards, the next two numbers in the random number table would be 74 and 94, but our highest numbered square on our grid is only 29 (Figure above). We would therefore ignore 74 and 94 and move on to the next number which is 22. We would then sample in Square 22. Continuing down the figures in this column, we would soon come across the number 20 again. As we have already selected this grid for sampling we would similarly ignore this number and continue on to the next. We would continue in this fashion until we had obtained enough samples to be representative of the habitat. There are other methods for selecting numbers from a random number table, but this is the simplest. In some habitats it may be difficult to set up numbered grids (e.g. in woodland) and in these a ‘random walk’ may be used. In this method, each sample point is located by taking a random number between 0 and 360, to give a compass bearing, followed by another random number which indicates the number of paces which should be taken in that direction. |
Continue to random number table and other methods of sampling
Can't find what you are looking for? Use Search

